Zabbix is an enterprise-class open-source software tool to monitor IT infrastructure such as networks, servers, virtual machines, and cloud services.
At Server Pundits, we use Zabbix software to monitor the server’s health, such as CPU, memory, storage usage…etc. The default Zabbix server configuration does not show the top processes sorted based on CPU/memory usage within the Linux environment. This metric will be beneficial for troubleshooting server-side performance-related issues.
In this article, we will explain the steps that need to be followed to list the top running processes sorted based on the CPU & memory usage within a Linux monitoring target. As you may already know, the Zabbix server collects data from a monitoring target using the Zabbix agent software. So, add the following configuration option to the Zabbix agent configuration file :
sudo nano /etc/zabbix/zabbix_agentd.conf
UserParameter=system.topcpu[*], ps -eo pid,ppid,cmd,%mem,%cpu --sort=-%mem | headThe above configuration will list the top running processes based on the CPU & memory usage. After making the above changes, please restart the Zabbix agent by executing the following command:
sudo systemctl restart zabbix-agentThe next step is to visualize the data sent by the Zabbix agent software. Please login to the Zabbix server UI and then navigate to the following location:
Configuration --> Templates --> Linux by Zabbix agentAfter navigating to the above section, please click on the “Items” option. The following is the example view:
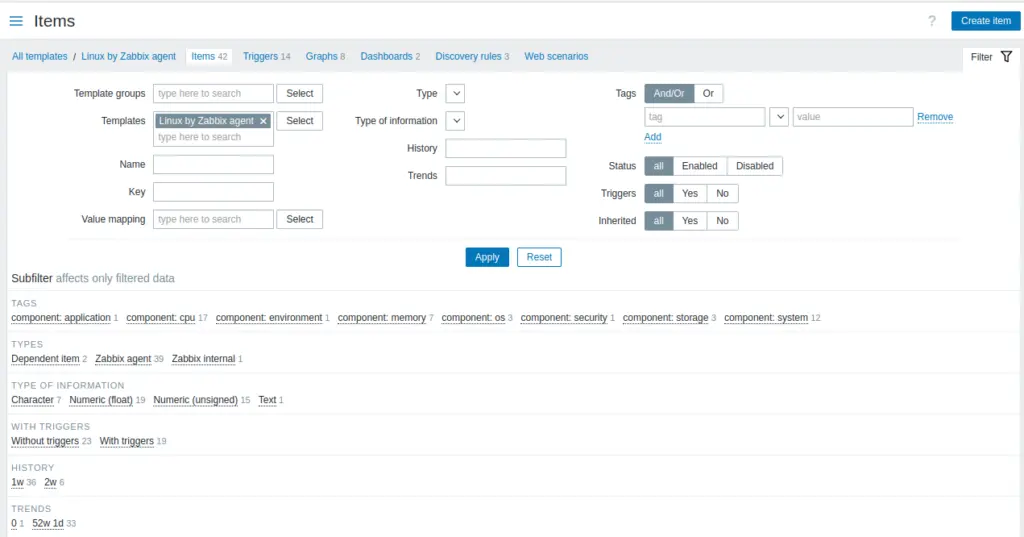
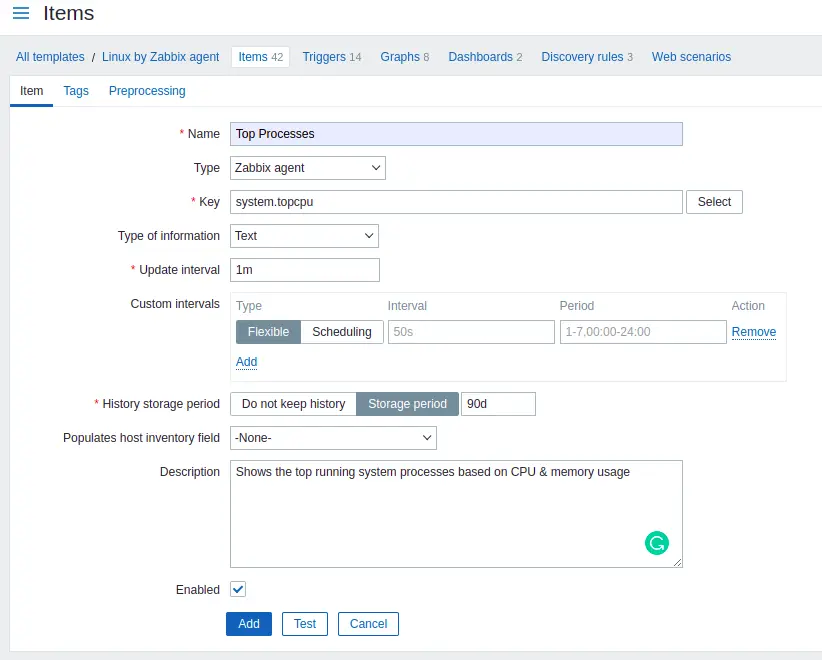
From the top right corner, click on the “Create item” option and input the following data:
Name: Top Processes
Type: Zabbix Agent
Key: system.topcpu
Type of information: Text
Update interval: 1m
Click on the “Add” button to complete the item addition.
Now, it’s time to visualize the data. Please navigate to the following section:
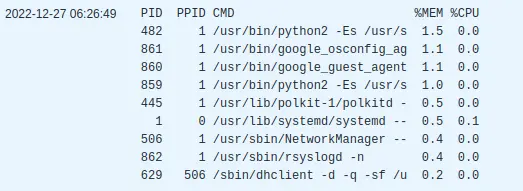
Zabbix Dashboard --> Monitoring --> Latest DataChoose the hostname for which you want to see the top process information. Click on the “Top Processes” option next to the hostname, and then choose the “values” option. The output will look similar to the following:
Server monitoring can be time-consuming, regardless of whether you are experienced or a beginner. By outsourcing server management and end-user technical support to the Server Pundits team, you can free up time to focus on your core business.